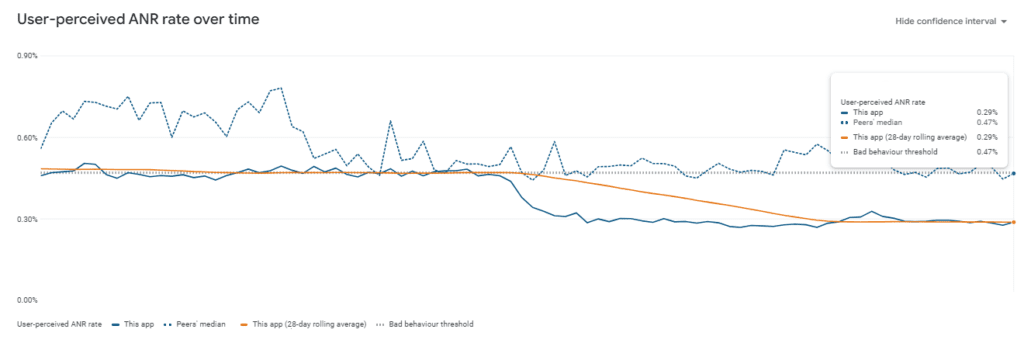
ANR (Application Not Responding) issues arise in Android apps, and they are difficult to detect and fix. They have a negative impact on the algorithm Google uses to highlight apps when users search its store, so keeping them below the required threshold is crucial.
How does an ANR happen?
Android applications are multithreaded, which means they run multiple tasks in parallel using various threads. The operating system uses one of these threads, known as UIThread, to communicate with the app through a queue of messages. For example, if the user touches the screen, the operating system adds a message to the queue containing information about this, so that when it processes it, it acts accordingly.
When the UIThread takes too long to process the messages in the queue, the operating system displays an error message to the user, which says that the app is not responding and lets the user close the app (and sends a message to the store telling them this).
At Axes In Motion we develop our games using Unity3D, which runs its logic in its own thread. This thread may take a long time to process some tasks, and may even freeze without generating any ANR. But the problem arises when you unknowingly send certain tasks to the main thread using third-party plug-ins. During startups in particular, it is a good idea to wait for one task to finish before starting the next one, as many require access to the main thread.
Doing this has normally helped us reduce ANRs, but it was not enough. Our percentage of ANRs had recently risen above the threshold, and we didn’t understand why.
How can they be identified?
One of our first mistakes was to treat ANRs in the same way as normal bugs, and to look at the stacktrace that came with the report. Although this stacktrace is very useful for fixing normal bugs, in practice we have found that it does not contain information related to ANRs, as this is usually sent when the ANR is no longer happening.
After unsuccessfully trying several third party tools, we decided it was best to adopt our own solution to find out the exact point in time when they occurred. The main aim of this solution is to report the exact point in time when the problem occurs, generating a report that shows all the steps the user has taken to reach that point.
In order to send these reports, we used breadcrumbs from Firebase, which are sent with the ANR report, in the Logs & Breadcrumbs section.

To find out when an ANR happens, we created a Watchdog, which is simply a thread that regularly queues a message in the UIThread and looks at how long it takes to process it. When the thread sees that there is no response, it adds a breadcrumb to the report, indicating the exact point in time when the problem arose.
How can they be solved?
Once the reports start coming in, we read them one by one and try to identify patterns. In our case, we found that one of the plug-ins had problems initialising, even when it did so in isolation from the other plug-ins.
After solving this problem, our ANRs dropped below the threshold, allowing us to deploy again at 100%.

Conclusions
- What is most important is to understand how Android apps work in order to distinguish between bugs and ANRs.
- Finding the cause of the problem is essential, even if it takes time. Being able to deploy versions to a small percentage of users in order to receive reports is critical, and can take days, weeks or even months.
- The simplest solution is usually the best; a simple watchdog sending reports is more than enough.
- It is best to ignore the stacktrace sent with the ANR report, as it does not usually provide any useful information.


